In recent years, emerging fields such as new energy vehicles, energy storage, communications, and data centers have developed rapidly, which has greatly promoted the development of large-capacity lithium-ion batteries. Various fields have put forward higher requirements on the energy density of lithium-ion batteries. [1].
The active energy storage material of the lithium ion battery is a positive and negative electrode material, and the method for increasing the energy density is to increase the discharge voltage and the discharge capacity for the positive electrode. For the negative electrode material, it is a high capacity and a low average delithiation voltage. In the third-generation lithium-ion battery with the energy density as the main development goal, the positive and negative materials are in the stage of upgrading [2-3]. Further improvement of energy density in the future will lead to the development of batteries using metal lithium anodes.
Therefore, it is particularly important to calculate the energy density in a lithium battery. Based on the consideration of active materials and inactive materials, the energy density of different cells that do not include packaging materials and tabs is calculated. Then calculate the energy density of the cylindrical 18650 monomer, calculate the expected energy density according to the calculation, and further calculate the battery cost.
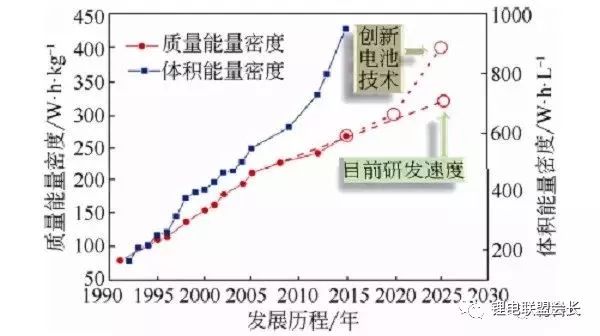
Figure 1 Development chart of energy density of lithium-ion battery in 1990-2030
ã€text
I. Energy density calculation of lithium ion battery cells with different anode materials
The positive and negative materials determine the energy density of the battery, but most of the literature calculates the energy density based on the quality of a single active cathode material. Some literatures consider the sum of the active materials of the positive and negative materials, ignoring the quality of the inactive battery materials. Therefore, the calculation result is larger than the actual deviation.
According to the calculation method of the literature [4], the energy density of common positive and negative lithium battery materials is calculated. The capacity and voltage are shown in Table 1 and Table 2. Recently, the capacity of cathode materials is increasing, but there is still a large gap with the theoretical value. The selection of the highest capacity does not use the highest value reported, but the values ​​of Tables 1 and 2 are selected considering the feasibility of the technical indicators. There are still many problems in achieving this value, such as controlling volume expansion, rate characteristics, and cycle characteristics. Table 3 gives typical parameters for the removal of packaging materials and leads, inactive materials inside the packaging material [4].
However, the shape of the battery varies, and the cell in this work refers to all other materials that do not contain the encapsulating material and leads, and most of the calculations are based on the results of the cell. Moreover, since the allowable thickness of the electrode coating, the battery of different shapes, and the characteristic parameters of the inactive material have a certain influence on the calculation result, the calculation result of the table may have a certain deviation from the actual battery, which is closely related to the battery manufacturing process.
Figures 29(a)-(j) show the calculation results of the energy density of the cells formed by the combination of 10 different negative electrodes and 16 positive electrode materials. Figure 2(i) shows that the Li-rich-300 vs. Si-C-2000 cell system has the highest mass energy density of 584Wh kg-2 in all battery systems, and the highest volumetric energy density of 1645Wh L-1 (not Includes packaging materials and tabs).
Table 1 Calculate the positive active material used and its specific capacity and voltage
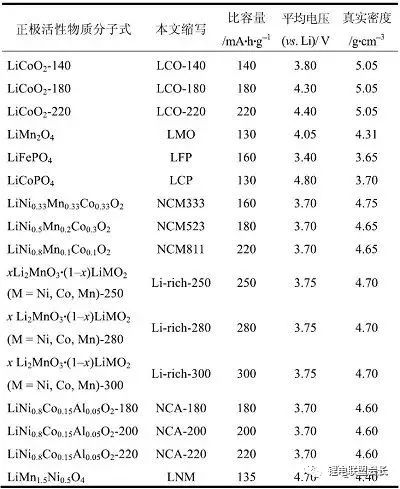
Table 2 Calculate the mass of the negative active material used and its specific capacity and voltage
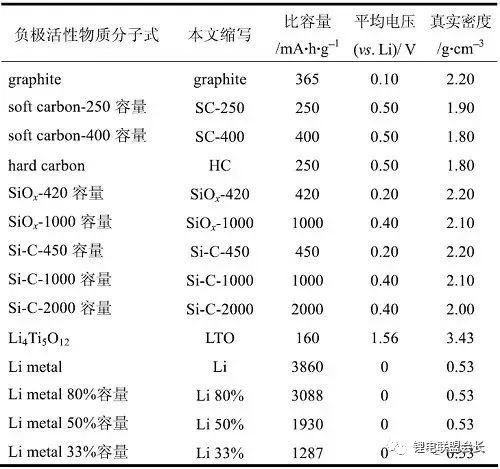
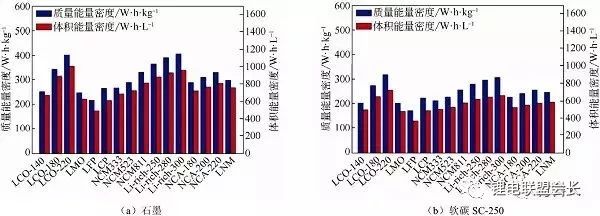
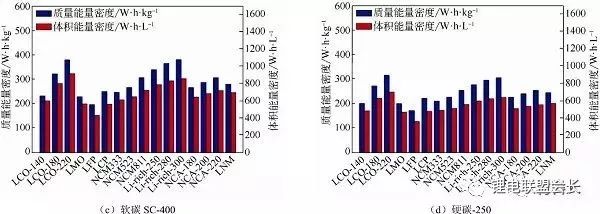
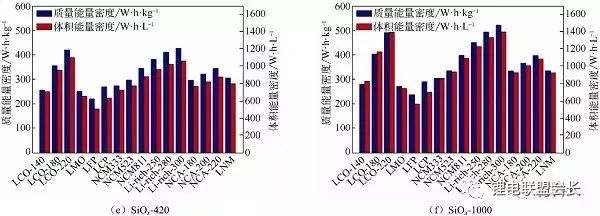
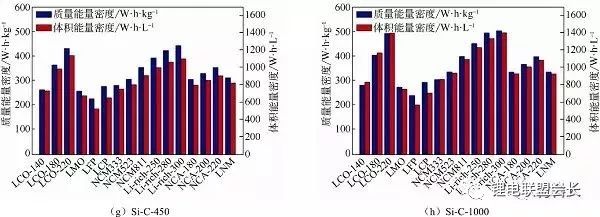
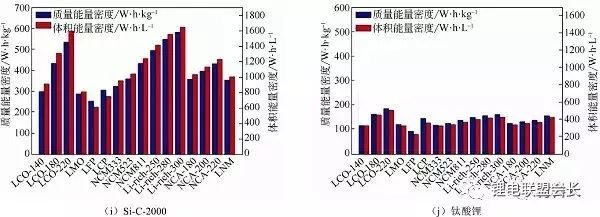
Figure 2 Calculation of cell energy density for different anode materials and different cathode materials (a) graphite; (b) soft carbon SC-400; (d) hard carbon-250; (e) SiOx-420; (f) SiOx- 1000; (g) Si-C-450; (h) Si-C-1000; (j) lithium titanate
Second, metal lithium ion battery cell energy density calculation
The above calculation results are all negative electrode materials, the theoretical specific capacity of graphite is 372mAh g-1 [5], the current reversible capacity can reach 365mAh g-1, and the reversible capacity of high-capacity track negative electrode materials can reach 1000-1500mAh g-1. However, there is a large volume expansion and contraction in the process of deintercalating lithium, and it is difficult to fully exert the actual capacity, which is only 380-450 mAh g-1. In contrast, the theoretical specific capacity of metallic lithium is as high as 3860 mAh g-1, and even if the utilization rate is 33%, there is 1287 mAh g-1, and it can serve as a lithium source. However, metallic lithium has many safety problems such as lithium dendrite, uneven growth of pores, continuous side reaction with electrolyte, volume expansion problems, and interface stability during circulation.
Considering the different possibilities of lithium metal capacity in different batteries, this work calculated the energy density of lithium metal batteries with different lithium metal utilization rates of 100%, 80%, 50%, and 33%, respectively. Comparing Fig. 3 with Fig. 2, it can be seen that when the metal lithium capacity is exerted, the same positive electrode system, the metal lithium ion battery has a more significant energy density than the lithium battery. For example, Li-rich-300 cathode material has an energy density of 649Wh kg-1 when metal lithium is used as a negative electrode, and has an energy density of 521Wh kg-1 even when only 33% is used.
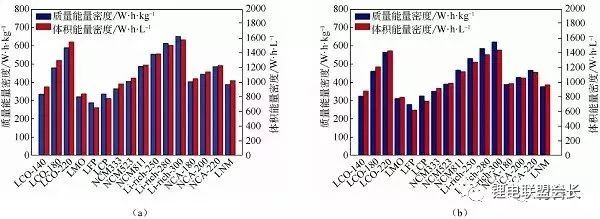
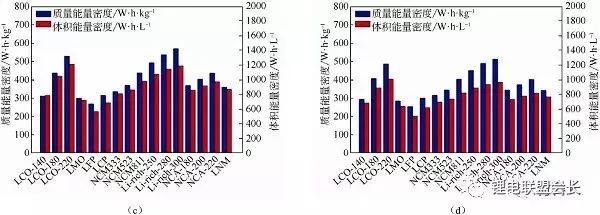
Figure 3 Energy density calculation of metal core as negative electrode
(a) full capacity of Li;
(b) Li capacity is 80%;
(c) Li capacity is 50%;
(d) Li capacity is 33%.
Third, 18650 single cell energy density estimation
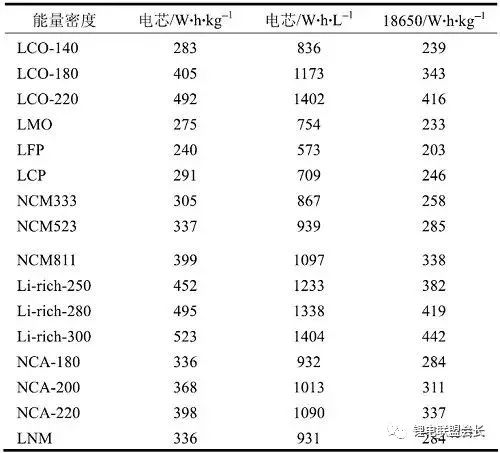
Considering the connected tabs and packaging materials, the energy density of the individual cells can be calculated. Tables 4 and 5 show the performance parameters of the loose NCR18650 cylindrical battery and the Prismatic series soft-packed square single cell [6]. Taking the NCR18650 as an example, the mass fraction of the tabs and packaging materials in the single cell is generally 15%-20%. Table 6 summarizes the highest energy density of the corresponding anode of the lithium battery and the highest energy density of 18650. Table 7 shows the cell and monomer energy density of Si-C-1000 negative electrode and different positive electrode materials. The energy density of LCO-220 cell is 492Wh kg-1, and the monomer energy density is 416Wh kg-1. As the package material accounts for a larger proportion of the battery, the energy density of the battery is further reduced.
Table 4 Panasonic NCR18560 battery performance and parameters
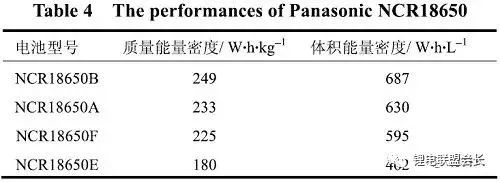
Table 5 Panasonic Prismastic battery performance and parameters
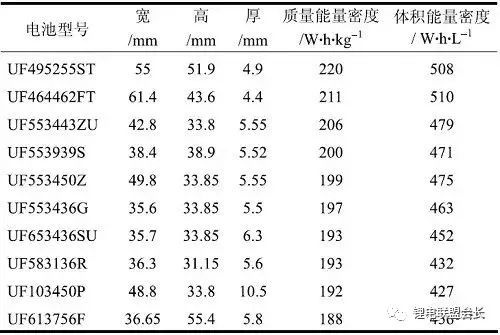
Table 6 Summary of the highest cell energy density and highest monomer energy density of different anode materials
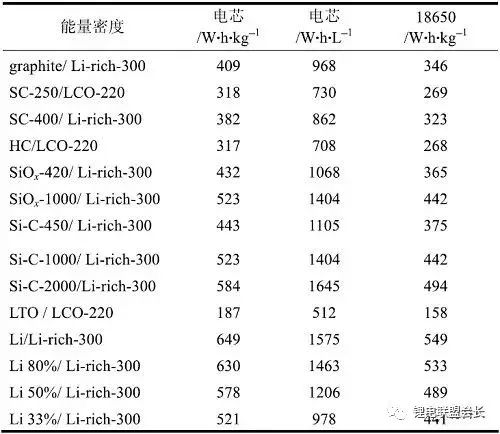
Table 7 Summary of energy density and monomer energy density of Si-C-1000 anode and different cathode materials
Fourth, the relationship between battery energy density and cruising range
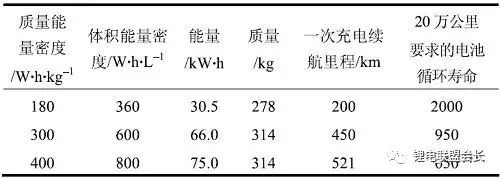
The cruising range is the core indicator of electric vehicles. The simplest way to increase the cruising range is to directly increase the single battery or battery module and capacity, but this will increase the cost of the battery in the electric vehicle; the other is in the car. Increase the energy density of the battery under the premise that the battery pack has the same volume or quality.
Taking Beiqi EV200 (the whole set quality is 1.290t) as an example, the power consumption per 100 kilometers is 14kWh, the battery box is 220L, and the life requirement is 200,000 kilometers. When the mass energy density of the battery is 180Wh kg-1, the cruising range of the EV200 standard working condition is 200km at normal temperature. The estimation of cycle life needs to consider the design requirements of the full-life mileage. Each time the cruising range and the end of life are used, the battery life of each battery is estimated to be 2000 times. The battery life of the electric vehicle is not improved. [10.85kWh/(100kmt)], keep the battery pack volume constant, when the battery's mass energy density reaches 400Wh kg-1, the electric vehicle's cruising range can reach 521km, 200,000km required battery cycle life estimation With a value of 600, meeting this technical standard will address consumer anxiety about electric vehicle mileage (Table 8).
Table 8 Estimation of the relationship between battery energy density and electric vehicle cruising range
Fifth, the cost of high energy density lithium battery
According to the existing industrialized battery core composition and process conditions, the cost price of raw materials for different battery cells can be roughly estimated. The cost of the raw materials used is shown in Table 9. Take the battery of 100Ah capacity as an example. Figure 4 shows the cost of lithium battery with silicon carbon as the negative electrode and different positive electrode materials, and the metal lithium ion battery cell with lithium metal as the negative electrode, lithium rich and NCM as the positive electrode material. the cost of. It can be concluded that the cost of the cathode material and the electrolyte is close to 37%-56% of the cost of the battery, and the cost of the silicon carbon anode is generally close to 38%-48%, accounting for a large proportion of the cost of the battery. When lithium metal is used as the negative electrode, lithium is rich, and the cost of NCM as the positive electrode material cell is 0.2 yuan / watt hour and 0.29 yuan / watt hour, respectively. Compared to silicon carbon as a negative electrode, metallic lithium has a higher energy density and a significant cost reduction.
It should be noted that the cost of the battery material accounts for 60%-70% of the battery manufacturing cost. The above cost estimate also needs to be divided by 0.6-0.7, which is the actual cost of the single battery. From the results, the cost of metal lithium-ion batteries can be further reduced to even lower than that of lead-acid batteries.
Table 9 100Ah battery core raw material cost
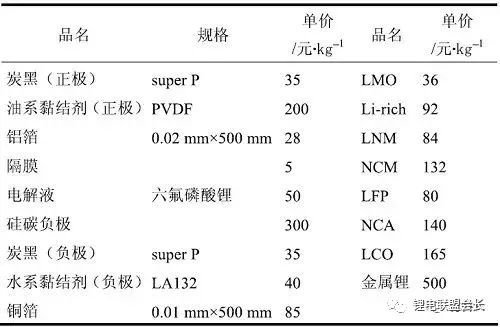
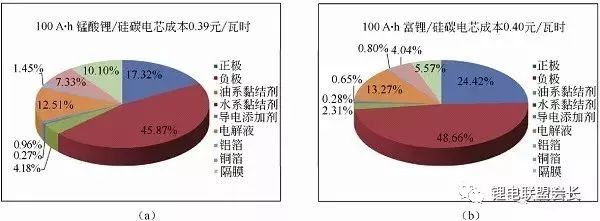
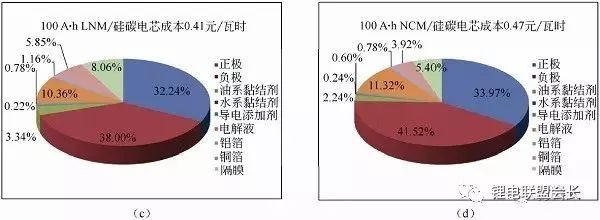
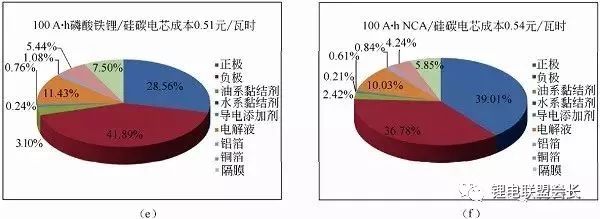
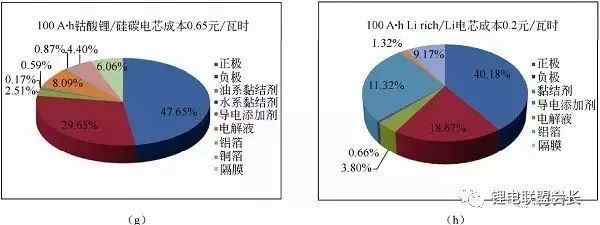
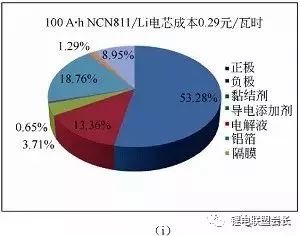
Figure 4 Lithium-ion battery cell cost estimation
Sixth, comprehensive technical indicators
The application of the battery not only requires energy density, but also other technical indicators such as power density, charging rate, cycle life, service life, energy efficiency, safety index, and unit battery cost. Whether the battery can be applied depends on whether a certain technical indicator can Meet the minimum requirements of the application, called the "cask effect" of the battery. Figure 5(a) shows a spider diagram of the main technical indicators for different application areas, and Figure 5(b) shows a spider diagram of the expected values ​​of the various indicators of the pure electric vehicle and the current actual values. There is a big gap between current levels and expectations, and new power battery technologies need to be developed.
From 1990 to the present, the actual energy density of the battery is mainly increased by increasing the mass ratio of the positive and negative active materials in the battery and reducing the mass ratio of the inactive materials. In terms of technology, it is indeed possible to further reduce the thickness and quality of the separator, Cu, Al foil and the mass fraction of the packaging material, but the challenge is very large. Choosing a new system of positive and negative materials has become a relatively easy technical choice to increase battery energy density. From the calculation results, it can be seen that with a high-capacity silicon-carbon anode and a lithium-rich manganese-based anode, the energy density of the 18650 battery can reach 442Wh kg-1, and the corresponding battery price can be reduced to 0.4 yuan/watt hour. The ground meets the requirements of pure electric vehicles for battery life and cost control. The lithium-rich manganese-based metal ion battery has the highest mass energy density, which can reach 521 Wh kg-1, and the cost can be reduced to 0.2 yuan / watt hour. At present, there is a large technical bottleneck in the chargeable metallurgical battery using liquid electrolyte, mainly the chemical and electrochemical side reactions of metallurgical and liquid electrolytes, and subsequent solid-state batteries are expected to solve these problems. It should be noted that while increasing the energy density, it is also necessary to meet the requirements of other performance indicators, which requires complex and arduous scientific and technological research, which is full of challenges but has strong appeal.
Marine Generator with marine diesel engine, marine alternator, control system
. World famous brand marine diesel engine: Cummins, Yuchai, Weichai
. World famous brand alternator: Stamford, Leroy Somer, Marathon, Mecc Alte, Faraday
. Marine control system: Deepsea, ComAp, Deif, SmartGen
. Water Heat Exchanger Type cooling system
Marine Engine,Marine Genset,Marine Generator,Marine Engine Generator
Guangdong Superwatt Power Equipment Co., Ltd , https://www.swtgenset.com